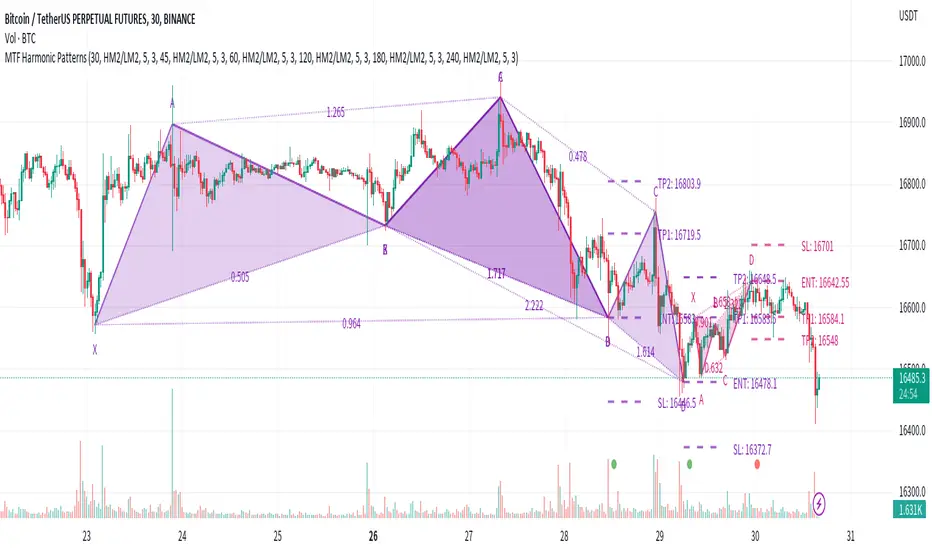
Multi-timeframe Harmonic PatternsHello friends. In recent months I have been busy with my academic research and haven't had much time to publish new scripts. To fill the gap of these months, I decided to publish the indicator Multi-timeframe Harmonic Patterns . Harmonic technical chart patterns can predict the next price trend and provide traders with clues to the price direction, which is one of the indicators widely used by professional traders.
(1) Indicator description
This indicator is built on ZigZag Multi Time Frame with Fibonacci Retracement@LonesomeTheBlue . Thanks to LonesomeTheBlue for contributing the awesome indicator
The indicator supports 6 different timeframes , and 25 different harmonic patterns
This indicator supports indicating key indicator prices: entry price, stop loss price, and two take profit prices
(2) Key parameters
timeframe resolution: The timeframe of the harmonic pattern
pivot high/low source: Calculation method of high/low pivot points
timeframe pivot period: Minimum period of high/low pivot points
delay for confirmations: Wait for N candles to confirm the chart pattern
bullish/bearish colors: Bullish/bearish pattern colors
enable harmonic patterns: Enable current harmonic patterns
show harmonic patterns: Show harmonic patterns found
show trading prices of patterns: Show key prices of harmonic patterns
(3) Supported Patterns:
Gartlay
Cypher
Bat
Deepcrab
Crab
Butterfly
Shark
0-5
AB=CD
3-Drives
Anti-Gartlay
Anti-Cypher
Anti-Bat
Anti-Crab
Anti-Butterfly
Anti-Shark
Black-Swan
White-Swan
Descending-Triangle
Ascending-Triangle
Symmetrical-Triangle
Headers&Shoulders
Inverse-Headers&Shoulders
Double-Top
Double-Bottom
————————————————————————————————————————
各位朋友大家好。最近几个月我忙于自己的学术研究没有过多时间更新脚本。为弥补这几个月的空缺,我决定发布该 多时间周期的谐波指标 。谐波技术图表形态在一定程度上可以预测下一个价格走势,为交易者提供价格方向的线索,是广大专业交易人员广泛使用的指标之一。
(1) 指标说明
该指标建立于 ZigZag Multi Time Frame with Fibonacci Retracement@LonesomeTheBlue ,感谢LonesomeTheBlue贡献的出色指标
该指标支持 6种不同的时间周期 ,以及 25种不同的谐波形态
该指标支持指示关键的指标价格:入场价格、止损价格、以及两种止盈价格
(2) 关键参数
timeframe resolution: 谐波形态的时间周期
pivot high/low source: 高/低枢纽点的计算方式
timeframe pivot period: 高/低枢纽点的最小周期
delay for confirmations: 等待N个蜡烛以确认图表形态
bullish/bearish colors: 看涨/看跌的形态颜色
enable harmonic patterns: 使能当前的谐波形态
show harmonic patterns: 显示被发现的谐波形态
show trading prices of patterns: 显示谐波形态的关键价格
(3) 支持形态:
Gartlay
Cypher
Bat
Deepcrab
Crab
Butterfly
Shark
0-5
AB=CD
3-Drives
Anti-Gartlay
Anti-Cypher
Anti-Bat
Anti-Crab
Anti-Butterfly
Anti-Shark
Black-Swan
White-Swan
Descending-Triangle
Ascending-Triangle
Symmetrical-Triangle
Headers&Shoulders
Inverse-Headers&Shoulders
Double-Top
Double-Bottom
"pivot points" için komut dosyalarını ara
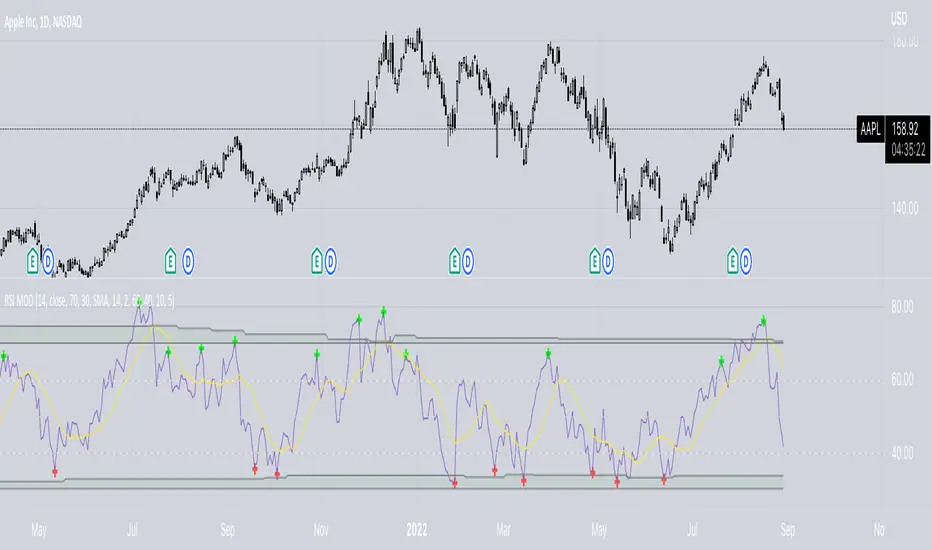
RSI ModifiedThe RSI is an excellent indicator for determining when equities are overbought/oversold. Though I believe there is a shortcoming in using the 70/30 levels since they are static and do not adjust for when an equity is trending. It stands to reason that in a downtrend, the overbought might be less than 70 and the oversold less than 30—Vice versa for a bull trend. Using the built-in function of pivots, I have attempted to create overbought/oversold lines that adjust with the trend. Leaving the 70/30 lines on the indicator also helps visualize the equity trend. All pivot settings are adjustable in the input menu. The pivot limits serve as a filter for recording pivot points. For example, with an upper pivot limit of 60, only pivots greater than 60 will be recorded into the array used to determine overbought. The crosses represent which values are used to determine overbought/oversold and do not provide timely indications.
Unraided Liquidity and S/R PivotsThis indicator is designed to show key pivot points, also known as levels, which could provide good trade entries.
Utilising liquidity concepts, untested pivot levels can be a good place to enter a trade after the pivot is tested, liquidity is taken and the direction reverses.
Alternatively, utilising the option of viewing already tested levels, you can easily see the key support and resistance areas that price is likely to have a strong reaction to, whether it wants to go toward or bounce away from these levels.
The indicator does not give buy and sell signals, it is up to you to use the levels to form your trading plan.
Oorah.

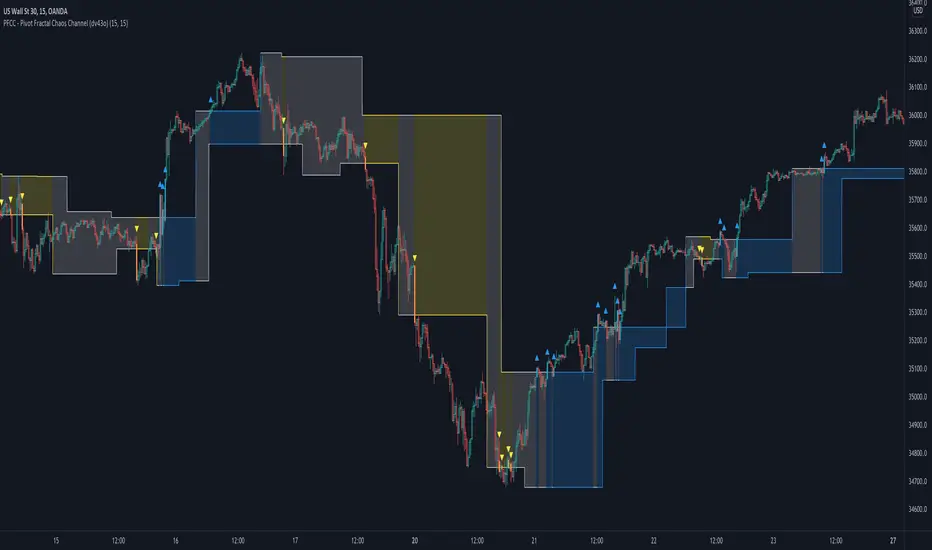
PFCC - Pivot Fractal Chaos Channel [Open Source]With the release of my indicator "TOTC - Trade outside the Channel" , the Pivot Fractal Chaos Channel used there has attracted significant interest.
Due to requests from some users, I am happy to publish the source code of the PFCC - although it is not "new" and has been implemented in many other scripts in one way or another. Some Examples:
Support and Resistance Levels with Breaks:
Support Resistance MTF:
Pivot Points High Low (HH/HL/LH/LL):
The code is briefly commented. Please feel free to use or further customize it ... And, of course, I would be happy to be named and/or linked. If you're satisfied, maybe buy me a coffee ;-)
I'm curious to see how this indicator will develop with more ideas - Please keep me updated by commenting below or by sending me a message.
Let's take a quick look at the function and idea
PFCC - "Pivot Fractal Chaos Channel" or also known as "Fractal Chaos Band" can serve as a baseline trend indicator for your strategy.
Essentially, the "Fractal Chaos Channel" shows an overall panorama of price action. As they filter out the insignificant price fluctuations. The upper level is created by drawing price highs and the lower level is created by drawing price lows.
Two Ideas, how this indicator can be used
Trend indicator: If the price breaks the upper line, it could be taken as a buy signal. If the price breaks the lower line, it could be taken as a sell signal.
Trailing Stop Loss: You can track the stop loss with the rising line in case of a buy trade. On the other hand, you can track the stop loss with the falling fractal line in case of a sell trade.
What do I need to consider?
It may be advisable to add further indicators and an analysis of the market structure in order to confirm the signals issued by the indicator. Please note that when you make adjustments to any strategy, you always carry out particularly detailed tests.
You would like to use this indicator, but you have adjustment requests, you want to have additional filters or features implemented, ...?
I am happy to create individual indicators based on "PFCC - Pivot Fractal Chaos Channel" or your ideas. Write me a message and we will discuss the details and conditions.
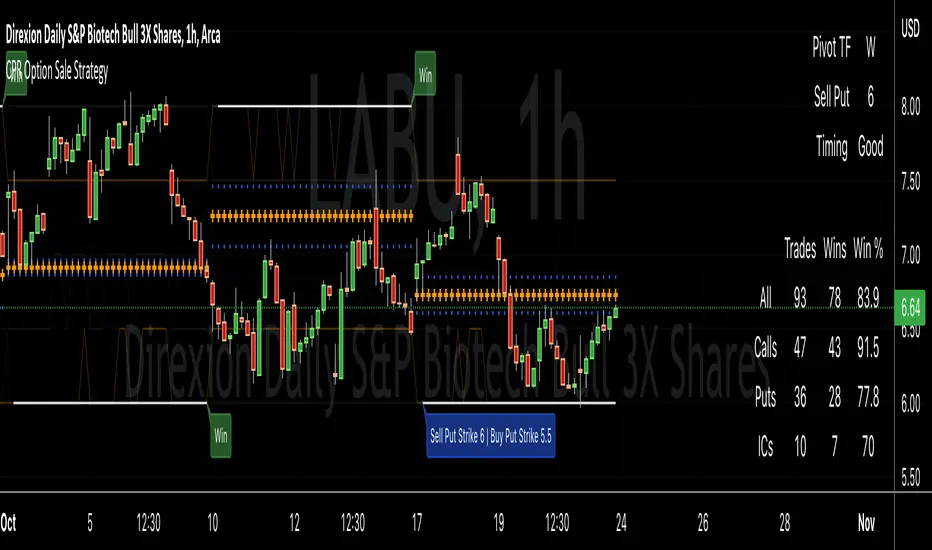
CPR Option Selling StrategyGood afternoon traders,
This is a script I built for option selling, in attempt to have a high success rate.
The gist of how it works:
It uses the opening or close of the current chart's timeframe opening bar when referenced against a designated (higher) timeframe's central pivot range (CPR).
Using that comparison, this script calculates an option to sell: put, call, or iron condor. It will calculate a call value using an average of the CPR central pivot and the max value of the prior higher timeframe's high or R1 (whichever is higher.)
It does the same for the put side, but uses the higher timeframe's low or S1 (whichever is lower.)
It will use the option on the other side of the source (open or close) of the CPR as the "option in play."
Settings:
There are many settings, most are simply "viewable" settings, and probably self explanatory, others, not so much:
"Source for Trigger" - this is the value used on the "opening bar," such as the close. This value is the one compared to the Central Pivot Range in determining whether to sell a call (if the source is lower,) sell a put (if the source is higher,) or an iron condor if it's in the CPR.
"Show Historical Win/Loss Percentages" - this shows a table in the bottom right of the W/L percentages for the current ticker and settings. Used for a quick glance at historical success rates.
"Extend Developing Levels Into the Future" - This will extend the developing values for CPR values, call and put values into the future (good for trying to trade early or setting up pre-market trades, assuming there will not be huge gap in one direction or another.)
"Select Higher Timeframe" - "Auto" will choose the higher timeframe for you. "Manual" will use the next field...
"If Manual, Timeframe for Pivots" - allows you to choose a different higher timeframe.
The next two sections are simply whether to show the plots for different levels of traditional and/or camarilla pivot points.
The last section will allow you to just filter on certain days. Really only useful for "backtesting" certain 0DTE trades on some daily options during the hourly chart.
Example use:
An example use (which I completed last week) on the chart referenced in this share: I sold a put-spread for $0.90, selling a 590 and buying a 570 strike in the middle of the week. I was looking at an hourly timeframe chart with a weekly pivot timeframe for the strategy.
Obviously, making only $0.90 on a $20 spread, there is a lot more to lose than to make, but I did some other analysis to go with it, so I felt safe, and I had a stop set for $1.50. So it worked, along with 3 other plays I did, very similar, and if that "Historical Win/Loss Percentage" is accurate, which I am fairly certain it is, I felt good about it.
The key all comes down to what you sell it for, right? That piece only you can determine. :)
Happy trading and enjoy,
Deuce
Swing Pivots High LowBINANCE:BTCUSDT
This indicator is an opensource merge of the built in 'Pivot Points High Low' and the most popular 'Swing-high-low-support-resistance' indicators. The original 'Pivot Points High Low' does not have extensions with better visibility, while the most popular 'Swing-high-low-support-resistance' has no source available. I've also added additional configurable alert conditions for Pivot High and Low Crossover/Crossunder.
Please read the official documentation for further information about the indicator.

Combo Backtest 123 Reversal & Pivot Point V2 This is combo strategies for get a cumulative signal.
First strategy
This System was created from the Book "How I Tripled My Money In The
Futures Market" by Ulf Jensen, Page 183. This is reverse type of strategies.
The strategy buys at market, if close price is higher than the previous close
during 2 days and the meaning of 9-days Stochastic Slow Oscillator is lower than 50.
The strategy sells at market, if close price is lower than the previous close price
during 2 days and the meaning of 9-days Stochastic Fast Oscillator is higher than 50.
Second strategy
Pivot points simply took the high, low, and closing price from the previous period and
divided by 3 to find the pivot. From this pivot, traders would then base their
calculations for three support, and three resistance levels. The calculation for the most
basic flavor of pivot points, known as ‘floor-trader pivots’, along with their support and
resistance levels.
WARNING:
- For purpose educate only
- This script to change bars colors.

Derivative Pivot HL Points Hello.
This script aims to take into account mutable variable Pivot Points' periods.
While doing this, it takes the period between 2 signals that I use in the script:
And these periods in my Pivot HL function integrated into len length (Mutable variables) :
The cornerstone of the script is these facts.
Pivot can be optimized by playing with reversal periods.
These pre-formed levels can be used as Supply and Demand levels.
Regards.

Accum/Dist + 200 EMAAccumulation / Distribution Indicator with a 200 EMA applied to it.
Helps to identify market trends and especially useful if combined with Pivot Points.
When AD line is above the 200 EMA and price is hovering above the central Pivot, we assume a bullish bias towards R1 and R2 resistance points. And vice-versa.

Standard Deviation W/Q/M PivotsThis is a re-iteration of the standard deviation of daily pivots with the pivots applied on weekly, monthly, quarterly and yearly levels. For intraday traders the weekly pivot points will act as a major support resistance levels. Quarterly and monthly pivot points are useful for short-term positions while the yearly pivot determines the stock's long term support-resistance levels and useful in determining if the stock is in a bullish/bearish leg.
SMC Academy [PhenLabs]📊 SMC Academy
Version: PineScript™ v6
📌 Description
The SMC Academy indicator is a comprehensive educational tool designed to demystify Smart Money Concepts (SMC) for traders of all levels. Unlike standard indicators that simply print signals, this script uses a “Learning Phase” system that allows users to toggle between individual concepts—such as Market Structure, Liquidity, Imbalances, and Order Blocks—or view them all simultaneously. It lets you focus on one piece of the puzzle at a time.
🚀 Points of Innovation
Progressive Learning Modes: Toggle between 5 distinct phases to master concepts individually before using the Full Strategy Mode.
Educational Tooltips: Hover over labels to read detailed explanations of why a BOS, MSS, or Liquidity zone was identified.
Smart Filtering: Uses ATR and Volume integration to filter out low-quality Fair Value Gaps and weak Order Blocks.
HTF Dashboard: A built-in panel analyzes Higher Timeframe (4H) data to ensure you are trading in alignment with the broader trend.
🔧 Core Components
Market Structure Engine: Automatically detects Swing Highs and Lows to map out market direction using configurable swing lengths.
Liquidity Manager: Identifies unmitigated swing points that serve as Buy-Side (BSL) and Sell-Side (SSL) liquidity magnets.
Imbalance Detector: Highlights Fair Value Gaps (FVG) where price inefficiencies exist, using ATR thresholds to ignore noise.
Order Block Identifier: Locates the specific candles responsible for structure breaks, validated by volume analysis.
🔥 Key Features
Break of Structure (BOS): Automatically marks trend continuation signals with solid lines and color-coded labels.
Market Structure Shift (MSS): Identifies potential trend reversals when significant swing points are breached.
Dashboard Context: Displays the current trend direction and the 4H context directly on your chart.
Custom Alerts: Built-in alert conditions for structure breaks and new Order Blocks allow for automated tracking.
🎨 Visualization
Structure Lines: Solid lines indicate confirmed breaks (Green for Bullish, Red for Bearish).
Liquidity Zones: Dotted lines extending rightward indicate resting liquidity levels that price may target.
FVG Boxes: Shaded boxes highlight imbalance zones, automatically extending for a user-defined number of bars.
Dashboard: A clean, non-intrusive table in the top-right corner displays trend status and active mode.
📖 Usage Guidelines
Setting Categories
Learning Mode: Select from ‘1. Market Structure’ through ‘5. Full Strategy Mode’ to filter what appears on the chart.
Swing Detection Length: Default (5). Determines the sensitivity of the swing high/low detection.
Structure Break Type: Options (Close/Wick). Choose whether a candle close or just a wick is required to confirm a break.
Min FVG Size: Default (0.5 ATR). Filters out gaps smaller than this multiplier to reduce noise.
Filter Weak OBs by Volume: Default (True). Only highlights Order Blocks where volume exceeds the 20-period average.
✅ Best Use Cases
Educational Study: Isolate “Phase 1: Market Structure” to practice identifying trend changes without distraction.
Trend Following: Use “Phase 3: Imbalances” to find entry points within an established trend.
Reversal Trading: Combine “Phase 2: Liquidity” and “Phase 4: Order Blocks” to catch reversals at key levels.
⚠️ Limitations
Subjectivity: Market structure can be interpreted differently depending on the swing length settings used.
Ranging Markets: Like all trend-following concepts, false BOS/MSS signals may generate during choppy, sideways price action.
Repainting: While the signals are non-repainting once confirmed, the live candle may flash a signal before the close if “Close” mode is selected.
💡 What Makes This Unique
Interactive Learning: The inclusion of tooltip explanations transforms this from a simple tool into an active mentor.
Phase-Based Workflow: The ability to strip the chart back to basics at the click of a button is unique to the PhenLabs ecosystem.
🔬 How It Works
Swing Analysis: The script calculates pivot highs and lows based on your length input to define the structural landscape.
Break Validation: It checks if price crosses these pivot points to trigger BOS (Continuation) or MSS (Reversal) logic.
Volume Confirmation: For Order Blocks, it looks back inside the swing leg to find the specific candle responsible for the move, verifying it has significant volume.
💡 Note:
For the best experience, start in Phase 1 to calibrate your Swing Detection Length to the specific volatility of the asset you are trading before enabling Full Strategy Mode.

Range Trading StrategyOVERVIEW
The Range Trading Strategy is a systematic trading approach that identifies price ranges
from higher timeframe candles or trading sessions, tracks pivot points, and generates
trading signals when range extremes are mitigated and confirmed by pivot levels.
CORE CONCEPT
The strategy is based on the principle that when a candle (or session) closes within the
range of the previous candle (or session), that previous candle becomes a "range" with
identifiable high and low extremes. When price breaks through these extremes, it creates
trading opportunities that are confirmed by pivot levels.
RANGE DETECTION MODES
1. HTF (Higher Timeframe) Mode:
Automatically selects a higher timeframe based on the current chart timeframe
Uses request.security() to fetch HTF candle data
Range is created when an HTF candle closes within the previous HTF candle's range
The previous HTF candle's high and low become the range extremes
2. Sessions Mode:
- Divides the trading day into 4 sessions (UTC):
* Session 1: 00:00 - 06:00 (6 hours)
* Session 2: 06:00 - 12:00 (6 hours)
* Session 3: 12:00 - 20:00 (8 hours)
* Session 4: 20:00 - 00:00 (4 hours, spans midnight)
- Tracks high, low, and close for each session
- Range is created when a session closes within the previous session's range
- The previous session's high and low become the range extremes
PIVOT DETECTION
Pivots are detected based on candle color changes (bullish/bearish transitions):
1. Pivot Low:
Created when a bullish candle appears after a bearish candle
Pivot low = minimum of the current candle's low and previous candle's low
The pivot bar is the actual bar where the low was formed (current or previous bar)
2. Pivot High:
Created when a bearish candle appears after a bullish candle
Pivot high = maximum of the current candle's high and previous candle's high
The pivot bar is the actual bar where the high was formed (current or previous bar)
IMPORTANT: There is always only ONE active pivot high and ONE active pivot low at any
given time. When a new pivot is created, it replaces the previous one.
RANGE CREATION
A range is created when:
(HTF Mode) An HTF candle closes within the previous HTF candle's range AND a new HTF
candle has just started
(Sessions Mode) A session closes within the previous session's range AND a new session
has just started
Or Range Can Be Created when the Extreme of Another Range Gets Mitigated and We Have a Pivot low Just Above the Range Low or Pivot High just Below the Range High
Range Properties:
rangeHigh: The high extreme of the range
rangeLow: The low extreme of the range
highStartTime: The timestamp when the range high was actually formed (found by looping
backwards through bars)
lowStartTime: The timestamp when the range low was actually formed (found by looping
backwards through bars)
highMitigated / lowMitigated: Flags tracking whether each extreme has been broken
isSpecial: Flag indicating if this is a "special range" (see Special Ranges section)
RANGE MITIGATION
A range extreme is considered "mitigated" when price interacts with it:
High is mitigated when: high >= rangeHigh (any interaction at or above the level)
Low is mitigated when: low <= rangeLow (any interaction at or below the level)
Mitigation can happen:
At the moment of range creation (if price is already beyond the extreme)
At any point after range creation when price touches the extreme
SIGNAL GENERATION
1. Pending Signals:
When a range extreme is mitigated, a pending signal is created:
a) BEARISH Pending Signal:
- Triggered when: rangeHigh is mitigated
- Confirmation Level: Current pivotLow
- Signal is confirmed when: close < pivotLow
- Stop Loss: Current pivotHigh (at time of confirmation)
- Entry: Short position
Signal Confirmation
b) BULLISH Pending Signal:
- Triggered when: rangeLow is mitigated
- Confirmation Level: Current pivotHigh
- Signal is confirmed when: close > pivotHigh
- Stop Loss: Current pivotLow (at time of confirmation)
- Entry: Long position
IMPORTANT: There is only ever ONE pending bearish signal and ONE pending bullish signal
at any given time. When a new pending signal is created, it replaces the previous one
of the same type.
2. Signal Confirmation:
- Bearish: Confirmed when price closes below the pivot low (confirmation level)
- Bullish: Confirmed when price closes above the pivot high (confirmation level)
- Upon confirmation, a trade is entered immediately
- The confirmation line is drawn from the pivot bar to the confirmation bar
TRADE EXECUTION
When a signal is confirmed:
1. Position Management:
- Any existing position in the opposite direction is closed first
- Then the new position is entered
2. Stop Loss:
- Bearish (Short): Stop at pivotHigh
- Bullish (Long): Stop at pivotLow
3. Take Profit:
- Calculated using Risk:Reward Ratio (default 2:1)
- Risk = Distance from entry to stop loss
- Target = Entry ± (Risk × R:R Ratio)
- Can be disabled with "Stop Loss Only" toggle
4. Trade Comments:
- "Range Bear" for short trades
- "Range Bull" for long trades
SPECIAL RANGES
Special ranges are created when:
- A range high is mitigated AND the current pivotHigh is below the range high
- A range low is mitigated AND the current pivotLow is above the range low
In these cases:
- The pivot value is stored in an array (storedPivotHighs or storedPivotLows)
- A "special range" is created with only ONE extreme:
* If pivotHigh < rangeHigh: Creates a range with rangeHigh = pivotLow, rangeLow = na
* If pivotLow > rangeLow: Creates a range with rangeLow = pivotHigh, rangeHigh = na
- Special ranges can generate signals just like normal ranges
- If a special range is mitigated on the creation bar or the next bar, it is removed
entirely without generating signals (prevents false signals)
Special Ranges
REVERSE ON STOP LOSS
When enabled, if a stop loss is hit, the strategy automatically opens a trade in the
opposite direction:
1. Long Stop Loss Hit:
- Detects when: position_size > 0 AND position_size <= 0 AND low <= longStopLoss
- Action: Opens a SHORT position
- Stop Loss: Current pivotHigh
- Trade Comment: "Reverse on Stop"
2. Short Stop Loss Hit:
- Detects when: position_size < 0 AND position_size >= 0 AND high >= shortStopLoss
- Action: Opens a LONG position
- Stop Loss: Current pivotLow
- Trade Comment: "Reverse on Stop"
The reverse trade uses the same R:R ratio and respects the "Stop Loss Only" setting.
VISUAL ELEMENTS
1. Range Lines:
- Drawn from the time when the extreme was formed to the mitigation point (or current
time if not mitigated)
- High lines: Blue (or mitigated color if mitigated)
- Low lines: Red (or mitigated color if mitigated)
- Style: SOLID
- Width: 1
2. Confirmation Lines:
- Drawn when a signal is confirmed
- Extends from the pivot bar to the confirmation bar
- Bearish: Red, solid line
- Bullish: Green, solid line
- Width: 1
- Can be toggled on/off
STRATEGY SETTINGS
1. Range Detection Mode:
- HTF: Uses higher timeframe candles
- Sessions: Uses trading session boundaries
2. Auto HTF:
- Automatically selects HTF based on current chart timeframe
- Can be disabled to use manual HTF selection
3. Risk:Reward Ratio:
- Default: 2.0 (2:1)
- Minimum: 0.5
- Step: 0.5
4. Stop Loss Only:
- When enabled: Trades only have stop loss (no take profit)
- Trades close on stop loss or when opposite signal confirms
5. Reverse on Stop Loss:
- When enabled: Hitting a stop loss opens opposite trade with stop at opposing pivot
6. Max Ranges to Display:
- Limits the number of ranges kept in memory
- Oldest ranges are purged when limit is exceeded
KEY FEATURES
1. Dynamic Pivot Tracking:
- Pivots update on every candle color change
- Always maintains one high and one low pivot
2. Range Lifecycle:
- Ranges are created when price closes within previous range
- Ranges are tracked until mitigated
- Mitigation creates pending signals
- Signals are confirmed by pivot levels
3. Signal Priority:
- Only one pending signal of each type at a time
- New signals replace old ones
- Confirmation happens on close of bar
4. Position Management:
- Closes opposite positions before entering new trades
- Tracks stop loss levels for reverse functionality
- Respects pyramiding = 1 (only one position per direction)
5. Time-Based Drawing:
- Uses time coordinates instead of bar indices for line drawing
- Prevents "too far from current bar" errors
- Lines can extend to any historical point
USAGE NOTES
- Best suited for trending and ranging markets
- Works on any timeframe, but HTF mode adapts automatically
- Sessions mode is ideal for intraday trading
- Pivot detection requires clear candle color changes
- Range detection requires price to close within previous range
- Signals are generated on bar close, not intra-bar
The strategy combines range identification, pivot tracking, and signal confirmation to
create a systematic approach to trading breakouts and reversals based on price structure, past performance does not in any way predict future performance

Camarilla Pivot Plays (Lite) [BruzX]█ OVERVIEW
This indicator implements the Camarilla Pivot Points levels and a system for suggesting particular plays. It only 3rd, 4th, and 6th levels, as these are the only ones used by the system. It also optionally shows the Central Pivot Range, which is in fact between S2 and R2. In total, there are 12 possible plays, grouped into two groups of six. The algorithm evaluates in real-time which plays fulfil their precondition and shows the candidate plays. The user must then decide if and when to take the play.
█ CREDITS
The Camarilla pivot plays are defined in a strategy developed by Thor Young, and the whole system is explained in his book "A Complete Day Trading System". This description is self-sufficient for effective use.
█ FEATURES
Display the 3rd, 4th and 6th Camarilla pivot levels
Works for stocks, futures, indices, forex and crypto
Automatically switches between RTH and ETH data based on criteria defined by the system.
Option to force RTH/ETH data and force a close price to be used in the calculation.
Preconditions for the plays can be toggled on/off
Works correctly on both RTH and ETH charts
Well-documented options tooltips
Well-documented and high-quality open-source code for those who are interested
█ HOW TO USE
The defaults work well; at a minimum, just add the indicator and watch the plays being called. For US futures, you will probably want to chat the "Timezone for sessions" to New York and the regular session times to 09:30 - 16:00. The following diagram shows its key features.
By default, the indicator draws plays 1 days back; this can be changed up to 20 days. The labels can be shifted left/right using the "label offset" option to avoid overlapping with other labels in this indicator or those of another indicator.
An information box at the top-right of the chart shows:
The data currently in use for the main pivots. This can switch in the pre-market if the H/L range exceeds the previous day's H/L, and if it does, you will see that switch at the time that it happens
Whether the current day's pivots are in a higher or lower range compared to the previous day's.
The width of the pivots compared to the previous day
The current candidate plays fulfilling preconditions. You then need to watch the price action to decide whether to take the play.
The resistance pivots are all drawn in the same colour (red by default), as are the support pivots (green by default). You can change the resistance and support colours, but it is not possible to have different colours for different levels of the same kind.
█ CONCEPTS
The indicator is focused around daily Camarilla pivots and evaluates the preconditions for 12 possible plays: 6 when in a higher range, 6 when in a lower range. The plays are labelled by two letters—the first indicates the range, the second indicates the play—as shown in this diagram:
The pivots can be calculated using only RTH (Regular Trading Hours) data, or ETH (Extended Trading Hours) data, which includes the pre-market and post-market. The indicator implements logic to automatically choose the correct data, based on the rules defined by the strategy. This is user-overridable. With the default options, ETH will be used when the H/L range in the previous day's post-market or current day's pre-market exceeds that of the previous day's regular market. In auto mode, the chosen pivots are considered the main pivots for that day and are the ones used for play evaluation. The "other" pivots can also be shown—"other" here meaning using ETH data when the main pivots use RTH data, and vice versa.
The plays must fulfil a set of preconditions. There are preconditions for valid region and range, price sweeps into levels, correct pivot width, opening position, price action, and whether neutral range plays and premarket plays are enabled. When all the preconditions are fulfilled, the play will be shown as a candidate.
█ NOTE FOR FUTURES
Futures don't officially have a pre-market or post-market like equities. Let's take ES on CME as an example. It trades from 18:00 ET Sunday to 17:00 Friday (ET), with a daily pause between 17:00 and 18:00 ET. However, most of the trading activity is done between 09:30 and 16:00, which you can tell from the volume spikes at those times, and this coincides with NYSE/NASDAQ regular hours. So we define a pseudo-pre-market from 18:00 the previous day to 09:30 on the current day, then a pseudo-regular market from 08:30 to 16:00, then a pseudo-post-market from 16:00 to 17:00. The indicator then works exactly the same as with equities—all the options behave the same, just with different session times defined for the pre-, regular, and post-market, with "RTH" meaning just the regular market and "ETH" meaning all three.
█ LIMITATIONS
The pivots are very close to those shown in DAS Trader Pro. They are not to-the-cent exact, but within a few cents. The reasons are:
TradingView provides free real-time data from CBOE One, not full exchange data (you can pay for this though, and it's not expensive), and
the close/high/low are taken from the intraday timeframe you are currently viewing, not daily data—which are very close, but often not exactly the same. For example, the high on the daily timeframe may differ slightly from the daily high you'll see on an intraday timeframe.
Despite these caveats, occasionally large spikes will be seem in one platform and not the other (even with paid data), or the spikes will reach significantly difference prices. Where these spikes create the daily high or low, this can cause significantly different pivots levels. The more traded the stock is, the less the difference tends to be. Highly traded stocks are usually within a few cents (but even they occasionally have large differences in spikes). There is nothing that can be done about this.
The 6th Camarilla level does not have a standard definition and may not match the level shown on other platforms. It does match the definition used by DAS Trader Pro.
Replay mode for stocks does not work correctly. This is due to some important Pine Script variables provided by the TradingView platform and used by the script not being assigned correct values in replay mode. Futures do not use these variables, so they should work in replay mode.
The indicator is an intraday indicator (despite also being able to show weekly and monthly pivots on an intraday chart). It deactivates on a daily timeframe and higher. Sub-minute timeframes are also not supported.
The indicator was developed and tested for US/European stocks, US futures and EURUSD forex and BTCUSD. It should work as intended for stocks and futures in different countries, and for all forex and crypto, but this is tested as much as the security it was developed for.
█ DISCLAIMER
This indicator is provided for information only and should not be used in isolation without a good understand of the system and without considering other factors. You should not take trades using real money based solely on what this indicator says. Any trades you take are entirely at your own risk.

Confluence Zone BuilderWhat It Does
The Confluence Zone Builder is a technical analysis indicator that identifies high-probability price levels by detecting where multiple technical factors align (converge) at the same price area. These "confluence zones" represent levels where price is statistically more likely to react - either bouncing (support/resistance) or breaking through (breakout targets).
How It Works
1. Multi-Factor Analysis
The indicator calculates key technical levels from various sources:
Fibonacci Retracements (23.6%, 38.2%, 50%, 61.8%, 78.6%) - Support/resistance levels based on recent price swings
Fibonacci Extensions (127.2%, 141.4%, 161.8%, 200%, 261.8%) - Breakout targets beyond the current range (both bullish and bearish)
Pivot Points (Classic pivots: P, R1-R3, S1-S3) - Daily/weekly reference points traders watch
Moving Averages (EMA 20, 50 and SMA 100, 200) - Dynamic support/resistance that institutions track
VWAP - Volume-weighted average price, popular among institutional traders
Psychological Levels - Round numbers that attract orders
Previous Period Levels - Prior day/week high, low, and close
2. Proximity Clustering
When multiple factors fall within a defined proximity range (default 0.5%), they're grouped together into a single "confluence zone." This prevents cluttering the chart with dozens of individual lines.
3. Weighted Scoring System
Not all technical factors are equal. The indicator assigns importance weights:
Key Fibonacci levels (61.8%) and major MAs (200, 50) get higher weights (2.0-2.5x)
Pivot points and VWAP get medium weights (1.5x)
Minor factors get lower weights (1.0x)
The total score reflects both the number of factors and their importance.
4. Historical Validation
The indicator analyzes the last 50 bars (customizable) to track:
Touches: How many times price reached each zone
Rejections: Times price bounced off the zone (✅)
Breaks: Times price broke through the zone (❌)
Win Rate: Percentage of times the zone held (rejections ÷ touches)
5. Dynamic Adjustment
Zones aren't static - they adapt based on how price interacts with them:
Strengthens (+0.5 per rejection, +0.2 per touch): Zones that repeatedly hold become more important
Weakens (-0.8 per break): Zones that fail to hold lose credibility
Visual Indicators:
Thick solid lines = Strong zones (more rejections than breaks)
Dashed lines = Weak zones (more breaks than rejections)
Color-coded by score: Blue (low), Yellow (medium), Red (high)
What You Gain From Using It
For Support/Resistance Trading:
High-probability entries: Enter at zones with high confluence scores and strong historical win rates
Better risk management: Place stops beyond strong confluence zones that are likely to hold
Reduced false signals: Multi-factor confirmation reduces reliance on single indicators
For Breakout Trading:
Target identification: Fibonacci extensions provide profit targets beyond current ranges
Breakout confirmation: Weak zones (dashed lines, low win rates) are easier to break - ideal for breakout entries
False breakout avoidance: Strong zones (thick lines, high win rates) require more confirmation before entering
For Position Management:
Exit planning: Take profits at high-confluence zones ahead
Stop placement: Use strong zones as logical stop-loss levels
Trade filtering: Higher probability setups occur at stronger zones
Key Advantages:
Objective confluence detection - No manual line drawing needed
Data-driven validation - Historical performance shows which zones actually matter
Adaptive intelligence - Zones strengthen/weaken based on real price action
Clean visualization - Top zones only, with compact labels showing score and factors
Customizable - Adjust weights, components, and thresholds to your trading style
Bottom Line:
Instead of guessing which technical level matters most, this indicator does the heavy lifting - analyzing multiple factors, validating them historically, and highlighting only the zones where price is most likely to react. It's like having confluence analysis automated with statistical backing.

Trend Pivots Profile [BigBeluga]🔵 OVERVIEW
The Trend Pivots Profile is a dynamic volume profile tool that builds profiles around pivot points to reveal where liquidity accumulates during trend shifts. When the market is in an uptrend , the indicator generates profiles at low pivots . In a downtrend , it builds them at high pivots . Each profile is constructed using lower timeframe volume data for higher resolution, making it highly precise even in limited space. A colored trendline helps traders instantly recognize the prevailing trend and anticipate which type of profile (bullish or bearish) will form.
🔵 CONCEPTS
Pivot-Driven Profiles : Profiles are only created when a new pivot forms, aligning liquidity analysis with market structure shifts.
Trend-Contextual : Profiles form at low pivots in uptrends and at high pivots in downtrends.
Lower Timeframe Data : Volume and close values are pulled from smaller timeframes to provide detailed, high-resolution profiles inside larger pivot windows.
Adaptive Bin Sizing : Bin size is automatically calculated relative to ATR, ensuring consistent precision across different markets and volatility conditions.
Point of Control (PoC) : The highest-volume level within each profile is marked with a PoC line that extends until the next pivot forms.
Trendline Visualization : A wide, semi-transparent line follows the rolling average of highs and lows, colored blue in uptrends and orange in downtrends.
🔵 FEATURES
Pivot Length Control : Adjust how far back the script looks to detect pivots (e.g., length 5 → profiles cover 10 bars after pivot).
Pivot Profile toggle :
On → draw the filled pivot profile + PoC + pivot label.
Off → hide profiles; show only PoC level (clean S/R mode).
Trend Length Filter : Smooths trendline detection to ensure reliable up/down bias.
Precise Volume Distribution : Volume is aggregated into bins, creating a smooth volume curve around the pivot range.
PoC Extension : Automatically extends the most active price level until a new pivot is confirmed.
Profile Visualization : Profiles appear as filled shapes anchored at the pivot candle, colored based on trend.
Trendline Overlay : Thick, semi-transparent trendline provides visual guidance on directional bias.
Automatic Cleanup : Old profiles are deleted once they exceed the chart’s capacity (default 25 stored profiles).
🔵 HOW TO USE
Spotting Trend Liquidity : In an uptrend, monitor profiles at low pivots to see where buyers concentrated. In downtrends, use high-pivot profiles to spot sell-side pressure.
Watch the PoC : The PoC line highlights the strongest traded level of the pivot structure—expect reactions when price retests it.
Anticipate Trend Continuation/Reversal : Use the trendline (blue = bullish, orange = bearish) together with pivot profiles to forecast directional momentum.
Combine with HTF Context : Overlay with higher timeframe structure (order blocks, liquidity zones, or FVGs) for confluence.
Fine-Tune with Inputs : Adjust Pivot Length for sensitivity and Trend Length for smoother or faster trend shifts.
🔵 CONCLUSION
The Trend Pivots Profile blends pivot-based structure with precise volume profiling. By dynamically plotting profiles on pivots aligned with the prevailing trend, highlighting PoCs, and overlaying a directional trendline, it equips traders with a clear view of liquidity clusters and directional momentum—ideal for anticipating reactions, pullbacks, or breakouts.

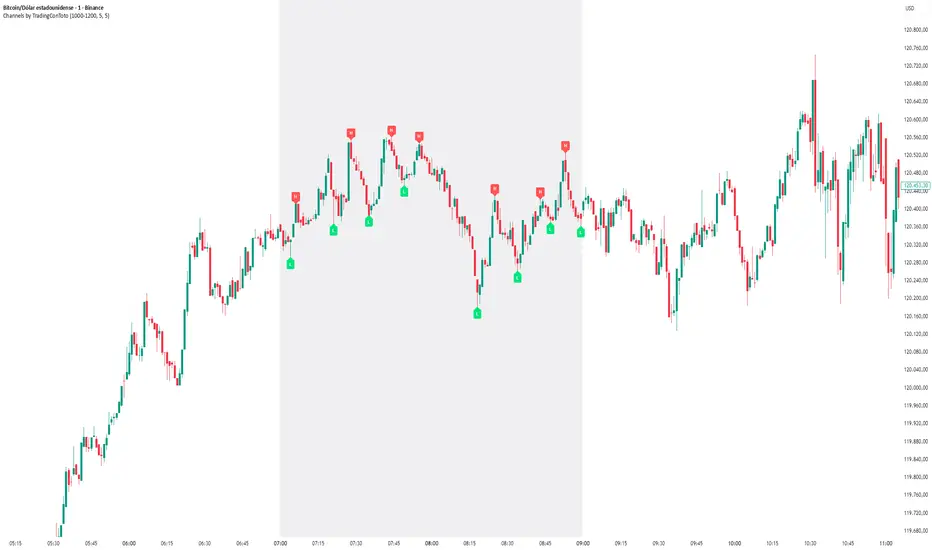
Channels by TradingConTotoThis indicator plots clear and minimalistic High (H) and Low (L) pivot points only within the selected trading session (e.g., 10:00–12:00).
During the active session, the background is shaded for easy visual reference, and pivot labels alternate automatically — meaning no consecutive H or L points appear in a row. This makes it simple to identify real swing changes within a specific session.
⚙️ Features
Detects and labels pivots only during the chosen time range.
Alternating logic prevents consecutive highs or lows (H → L → H → L).
Clean session background highlight for visual clarity.
Fully customizable parameters (session time, sensitivity, colors, etc.).
Ideal for intraday traders, scalpers, and structure-based strategies.
💡 Suggested Use
Perfect for traders who focus on specific market sessions (e.g., New York, London, or custom hours).
The alternating pivot logic helps visualize market swings and structural shifts without visual clutter, making it an excellent companion for price action analysis.
OSAMA RASMIHow this script works?
- it finds and keeps Pivot Points
- when it found a new Pivot Point it clears older S/R channels then;
- for each pivot point it searches all pivot points in its own channel with dynamic width
- while creating the S/R channel it calculates its strength
- then sorts all S/R channels by strength
- it shows the strongest S/R channels, before doing this it checks old location in the list and adjust them for better visibility
- if any S/R channel was broken on last move then it gives alert and put shape below/above the candle
- The colors of the S/R channels are adjusted automatically

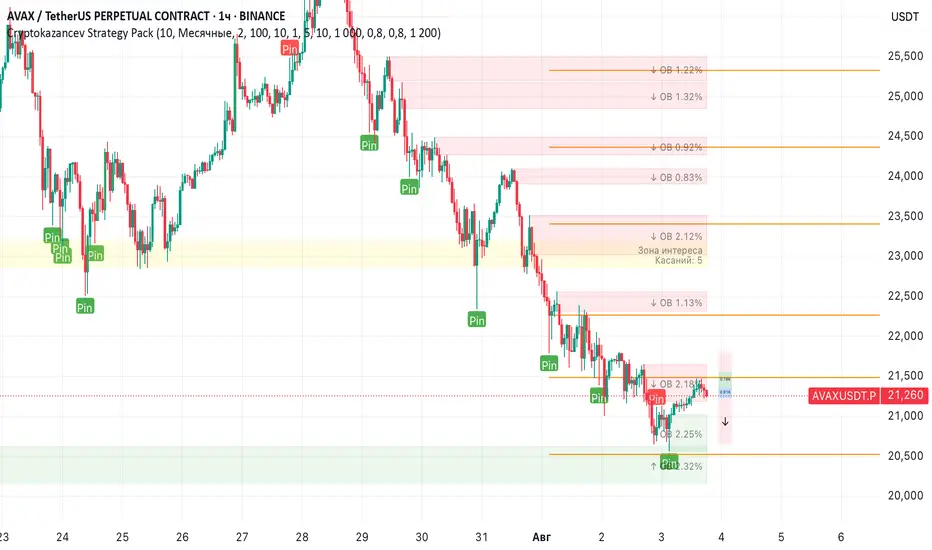
Cryptokazancev Strategy PackCryptokazancev Strategy Pack
Комплексный инструмент для анализа рыночной структуры / Comprehensive Market Structure Analysis Tool
🇷🇺 Описание на русском
Cryptokazancev Strategy Pack by ZeeZeeMon - это мощный набор инструментов для технического анализа, включающий:
• Ордерблоки (Order Blocks) с настройкой количества и цветов
• Пивоты (Pivot Points) различных таймфреймов
• Рыночную структуру с зонами Фибоначчи (0.618, 0.786)
• Разворотные конструкции (пинбары и поглощения)
• Зоны интереса на основе скопления свингов
📊 Основные функции:
1. Ордерблоки
- Автоматическое определение бычьих/медвежьих OB
- Настройка максимального количества блоков (до 30)
- Кастомизация цветов
2. Пивоты
- Поддержка таймфреймов: Дневные/Недельные/Месячные/Квартальные/Годовые
- Уровни Camarilla (P, R1-R4, S1-S4)
3. Рыночная структура
- Четкое определение тренда (UP/DOWN)
- Ключевые уровни Фибо (0.618 и 0.786)
- Настройка глубины анализа (10-1000 баров)
4. Разворотные конструкции
- Обнаружение пинбаров
- Обнаружение поглощений
- Настройка чувствительности
5. Зоны интереса
- Алгоритм кластеризации свингов
- Настройка через ATR-мультипликатор
- Лимит отображаемых зон
🇬🇧 English Description
ZeeZeeMon Pack is a comprehensive market analysis toolkit featuring:
• Order Blocks with customizable count and colors
• Pivot Points for multiple timeframes
• Market Structure with Fibonacci zones
• Reversal patterns (pinbars and engulfings)
• Interest Zones based on swing clustering
📊 Key Features:
1. Order Blocks
- Auto-detection of bullish/bearish OB
- Configurable max blocks (up to 30)
- Custom color schemes
2. Pivot Points
- Supports: Daily/Weekly/Monthly/Quarterly/Yearly
- Camarilla levels (P, R1-R4, S1-S4)
3. Market Structure
- Clear trend detection (UP/DOWN)
- Key Fibonacci levels (0.618 & 0.786)
- Adjustable analysis depth (10-1000 bars)
4. Reversal Patterns
- Smart pinbar detection
- ATR-based engulfing filter
- Sensitivity adjustment
5. Interest Zones
- Swing clustering algorithm
- ATR-multiplier configuration
- Display limit (up to 10 zones)
⚙️ Technical Highlights:
• Built with Pine Script v5
• Performance-optimized
• Well-commented code
• Flexible settings system
⚠️ Важно / Important:
Индикатор в бета-версии. Тестируйте перед использованием в реальной торговле.
This is BETA version. Please test before live trading.
💬 Поддержка / Support:
Комментарии к скрипту / Script comments section
Pivot and Wick Boxes with Break Signals█ OVERVIEW
This Pine Script® indicator draws support and resistance levels based on high and low pivot points and the wicks of pivot candles. When the price breaks these levels, breakout signals are generated, with an optional volume filter for greater precision. The indicator is fully customizable, allowing users to adjust box styles, pivot length, and signal settings.
█ CONCEPTS
The indicator relies on several key elements to identify and visualize important price levels and trading signals:
Pivot Identification
High and low pivots are detected using the ta.pivothigh and ta.pivotlow functions with a configurable pivot length. Boxes are drawn based on the pivot level and the wick of the pivot candle (top for high pivots, bottom for low pivots).
List of Features
1 — High and Low Pivot Boxes: The indicator draws boxes based on high pivot candles (red) and low pivot candles (green) and their wicks, with options to customize colors, border styles, and background gradient. Boxes are limited to 500 bars back, meaning support and resistance levels older than 500 candles are not displayed to maintain chart clarity.
2 — Breakout Signals: When the price closes above the upper edge of a high pivot box, a breakout signal is generated (green triangle below the bar). When the price closes below the lower edge of a low pivot box, a breakout signal is generated (red triangle above the bar).
Signals can be filtered using volume, requiring the volume at the breakout to exceed the average volume multiplied by a configurable multiplier.
3 — Box Management: The indicator limits the number of displayed boxes (default is 15 for high pivots and 15 for low pivots), removing the oldest boxes when the limit is reached. Boxes older than 500 bars are automatically removed.
Volume Filtering
An optional volume filter allows users to require breakout signals to be confirmed by volume exceeding the moving average of volume (calculated over a selected period, default is 20 days).
█ OTHER SECTIONS
FEATURES
• Show High/Low Pivot Boxes: Enables or disables the display of boxes for high and low pivots.
• Pivot Length: Specifies the number of bars back and forward for detecting pivots (default is 5).
• Max Boxes: Sets the maximum number of boxes for high and low pivots (default is 15).
• Volume Filter: Enables a volume filter for breakout signals, with a configurable multiplier and average period.
• Box Style: Allows customization of border color, background gradient, border width, and border style (solid, dashed, dotted).
HOW TO USE
1 — Add the indicator to your TradingView chart by selecting “Pivot and Wick Boxes with Break Signals” from the indicators list.
2 — Configure the settings in the indicator’s dialog window, adjusting pivot length, maximum number of boxes, colors, and style.
3 — Enable the volume filter if you want signals to be confirmed by high volume.
4 — Monitor breakout signals (green triangles below bars for upward breakouts, red triangles above bars for downward breakouts) on the chart.
LIMITATIONS
• New pivots are detected with a delay equal to the set pivot length. A lower pivot length value results in faster pivot detection but produces pivots with less significance as support or resistance levels compared to those generated with a longer value.
• Breakout signals may produce false signals in volatile market conditions, especially without the volume filter.
• Boxes are limited to 500 bars back, which may exclude older pivots on long-term charts.

Auto-Calculated Pivot Line/Zone (Based on Time Range)Automatically Calculated Pivot Line/Zone
Harness the power of precision with this Custom Time Range Average Line indicator—designed to pinpoint key equilibrium and pivot levels within consolidation zones after a breakout. Select any start and end time to capture the critical price action shaping the market structure between swings, and calculate the true average price using your choice of open, close, high, low, or midpoint.
Once the defined period concludes, the indicator freezes the average and extends it forward as a clear horizontal ray, acting as a powerful reference for fair value and market balance. This dynamic line shines brightest within consolidation phases, helping traders identify pivot points and equilibrium zones that often serve as magnets for price after a breakout.
Customize the line width to suit your style—use a thinner line width input for a precise single average line, or increase the width to visually represent a broader range or zone. Fully adjustable line color and thickness options ensure this tool integrates seamlessly into any chart setup.
Elevate your trading edge by visualizing the hidden balance points between market swings—turning consolidation chaos into clear, strategic opportunities!

Pullback Pro Dow Strategy v7 (ADX Filter)
### **Strategy Description (For TradingView)**
#### **Title:** Pullback Pro: Dow Theory & ADX Strategy
---
#### **1. Summary**
This strategy is designed to identify and trade pullbacks within an established trend, based on the core principles of Dow Theory. It uses market structure (pivot highs and lows) to determine the trend direction and an Exponential Moving Average (EMA) to pinpoint pullback entry opportunities.
To enhance trade quality and avoid ranging markets, an ADX (Average Directional Index) filter is integrated to ensure that entries are only taken when the trend has sufficient momentum.
---
#### **2. Core Logic: How It Works**
The strategy's logic is broken down into three main steps:
**Step 1: Trend Determination (Dow Theory)**
* The primary trend is identified by analyzing recent pivot points.
* An **Uptrend** is confirmed when the script detects a pattern of higher highs and higher lows (HH/HL).
* A **Downtrend** is confirmed by a pattern of lower highs and lower lows (LH/LL).
* If neither pattern is present, the strategy considers the market to be in a range and will not seek trades.
**Step 2: Entry Signal (Pullback to EMA)**
* Once a clear trend is established, the strategy waits for a price correction.
* **Long Entry:** In a confirmed uptrend, a long position is initiated when the price pulls back and crosses *under* the specified EMA.
* **Short Entry:** In a confirmed downtrend, a short position is initiated when the price rallies and crosses *over* the EMA.
**Step 3: Confirmation & Risk Management**
* **ADX Filter:** To ensure the trend is strong enough to trade, an entry signal is only validated if the ADX value is above a user-defined threshold (e.g., 25). This helps filter out weak signals during choppy or consolidating markets.
* **Stop Loss:** The initial Stop Loss is automatically and logically placed at the last market structure point:
* For long trades, it's placed at the `lastPivotLow`.
* For short trades, it's placed at the `lastPivotHigh`.
* **Take Profit:** Two Take Profit levels are calculated based on user-defined Risk-to-Reward (R:R) ratios. The strategy allows for partial profit-taking at the first target (TP1), moving the remainder of the position to the second target (TP2).
---
#### **3. Input Settings Explained**
**① Dow Theory Settings**
* **Pivot Lookback Period:** Determines the sensitivity for detecting pivot highs and lows. A smaller number makes it more sensitive to recent price swings; a larger number focuses on more significant, longer-term pivots.
**② Entry Logic (Pullback)**
* **Pullback EMA Length:** Sets the period for the Exponential Moving Average used to identify pullback entries.
**③ Risk & Exit Management**
* **Take Profit 1 R:R:** Sets the Risk-to-Reward ratio for the first take-profit target.
* **Take Profit 1 (%):** The percentage of the position to be closed when TP1 is hit.
* **Take Profit 2 R:R:** Sets the Risk-to-Reward ratio for the final take-profit target.
**④ Filters**
* **Use ADX Trend Filter:** A master switch to enable or disable the ADX filter.
* **ADX Length:** The lookback period for the ADX calculation.
* **ADX Threshold:** The minimum ADX value required to confirm a trade signal. Trades will only be placed if the ADX is above this level.
---
#### **4. Best Practices & Recommendations**
* This is a trend-following system. It is designed to perform best in markets that exhibit clear, sustained trending behavior.
* It may underperform in choppy, sideways, or strongly ranging markets. The ADX filter is designed to help mitigate this, but no filter is perfect.
* **Crucially, you must backtest this strategy thoroughly** on your preferred financial instrument and timeframe before considering any live application.
* Experiment with the `Pivot Lookback Period`, `Pullback EMA Length`, and `ADX Threshold` to optimize performance for a specific market's characteristics.
---
#### **DISCLAIMER**
This script is provided for educational and informational purposes only. It does not constitute financial advice. All trading involves a high level of risk, and past performance is not indicative of future results. You are solely responsible for your own trading decisions. The author assumes no liability for any financial losses you may incur from using this strategy. Always conduct your own research and due diligence.

HMA Swing Levels [BigBeluga]An advanced swing structure and trend-following tool built on Hull Moving Average logic, designed to detect major reversals and track dynamic support/resistance zones.
This indicator analyzes price swings using pivot highs/lows and a smoothed HMA trend baseline. It highlights key reversal levels and keeps them active until breached, giving traders a clear visual framework for price structure and trend alignment. The pivots are calculated in real-time using non-lagging logic, making them highly responsive to market conditions.
🔵 CONCEPTS
Combines a fast-reacting Hull Moving Average (HMA) with pivot logic to capture precise directional changes.
Detects non-lagging reversal highs and lows when pivot points form and the HMA direction flips.
Projects these reversal levels forward as horizontal support/resistance lines until broken by price.
Active trend is shown with a step-style trail line that reflects HMA bias over time.
🔵 FEATURES
Swing Level Detection:
Identifies high/low reversals when trend direction changes and plots horizontal zones.
Non-lagging logic of swing points detection:
if h == high and high < h and change > 0
// Detected Swing High
if l == low and low > l and change < 0
// Detected Swing Low
Persistent Support & Resistance Lines:
Each detected swing high or low is extended forward until price invalidates the level. Dotted style is applied once breached.
Color-Coded Trend Trail:
Displays a stepped trend trail using HMA slope: lime = uptrend, blue = downtrend.
Automatic Labeling:
Each reversal level is labeled with its price for clear reference.
Age-Based Line Thickness:
Every level increases in thickness every 250 bars. The longer the level lasts, the stronger it is.
🔵 HOW TO USE
Use green (support) and blue (resistance) levels to frame key reaction zones.
Trade with the trend defined by the trail color: lime for bullish bias, blue for bearish.
Explore where buy or sell orders are stacked
Look for breaks of swing lines to anticipate trend shifts or breakout setups.
Adjust the "Trend Change" input to tune the sensitivity of swing detection.
Adjust the "SwingLevels" input to define how far back to search for valid pivots.
🔵 CONCLUSION
HMA Swing Levels offers a hybrid approach to structural and trend-based trading. With automated non-lagging swing detection, persistent support/resistance tracking, and intuitive HMA-based trend coloring, it provides a powerful visual system for discretionary and systematic traders alike.

Gartley 222 Strategy (Final Full Version)Gartley 222 Strategy (Bullish Pattern) — Repaint-Free, Backtestable
This strategy is based on the classic Gartley 222 harmonic pattern, originally introduced by H.M. Gartley in Profits in the Stock Market (1935). It identifies potential bullish reversal zones by detecting a five-point retracement structure (X-A-B-C-D) using pivot points and Fibonacci confluence.
🧠 Strategy Logic:
Detects valid pivot-based X, A, B, C points
Validates Gartley ratios:
AB = 61.8%–78.6% of XA
CD = 78.6%–88.6% of AB
Enters long at point D only after pivot confirmation (non-repainting)
Exits at 127% Fibonacci extension of XA or on stop loss
🔍 Features:
✅ Repaint-free and fully backtestable
✅ Visual X–A–B–C–D pattern lines on chart
✅ Customizable pivot length, risk, and reward ratios
✅ Alerts for real-time Gartley Buy pattern completion
Ideal for swing traders using 4H or Daily timeframes on trending instruments like NIFTY, BANKNIFTY, or major stocks.